
There’s a new page we’re excited to share with SOAR providers and agencies across the country: the SOAR Infographics page!
This page houses key infographics to help your agency communicate the success and reach of SOAR. Here are just a few of the available infographics you can download today:
SOAR Overview
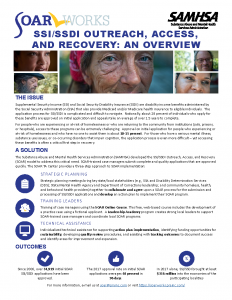
This one-page infographic provides an overview of the challenges individuals experiencing or at risk of homelessness who have a serious mental illness, medical impairment, and/or a co-occurring substance use disorder face when applying for Social Security’s disability benefit programs. It also shares an overview of how the SOAR model works, resources offered by the SAMHSA SOAR TA Center, and statistics on the efficacy of SOAR.
This infographic is great for:
- Agencies preparing to implement the SOAR model
- New providers using the SOAR model
SOAR Outcomes
This one-page infographic provides both an annual and cumulative look at the national impact of the SOAR model. Details are provided on approval rates, cumulative impacts (did you know that 40,311 people are receiving benefits because of SOAR?), financial outcomes, and top-performing states!
This infographic is great for:
- Potential funders who are looking to understand the impact and efficacy of SOAR
- State steering committees that want to engage new providers in the SOAR model
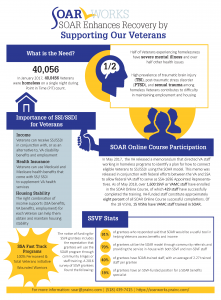
SOAR Enhances Recovery by Supporting our Veterans
This two-page infographic shares how SOAR has been used to enhance the recovery of Veterans who are experiencing or at risk of homelessness. It highlights how SOAR can be used with Veterans, the established partnerships SOAR has with the U.S. Department of Veterans Affairs (VA), and resources SOAR providers can access when assisting Veterans with Social Security and VA disability applications.
This infographic is great for:
- SOAR providers who are expanding their services to Veterans
- SSVF programs and VA Medical Centers that are interested in using the SOAR model
That’s not all! There are also infographics available that demonstrate the work of the SOAR TA Center, a guide providers can use to encourage beneficiaries to try working while receiving benefits, an infographic highlighting the relationship between SOAR and employment, and a roadmap providers can use to access funding. Bookmark this page, because new content will be added consistently; consider the SOAR infographics page a one-stop shop for all of your SOAR infographic needs!
Are you looking for a more tailored SOAR infographic to highlight your success? Email your SAMHSA SOAR TA Center liaison your request and we can create a custom infographic just for you!